Analytics
Group adminsAnalytics in InOrOut exist at two levels: per-team analytics and coach-level cross-team analytics.
Team analytics
BusinessTeam analytics live in the Analytics tab inside a specific group when that group’s effective plan reaches Business.
- Open a group you admin.
- Switch to Analytics.
- Use General for attendance, session activity, popular times, and guest trends.
- Use Activity Planning for planning totals, activation rate, voting engagement, and date-preference reporting.
General and Activity Planning appear as a compact sub-tab bar with an icon next to each label — the same sub-tab style used elsewhere in the app, for example on the Events tab and the profile’s Per Device tab.
Each card on those tabs opens a drill-down screen of its own — see What each drill-down shows.
Coach analytics
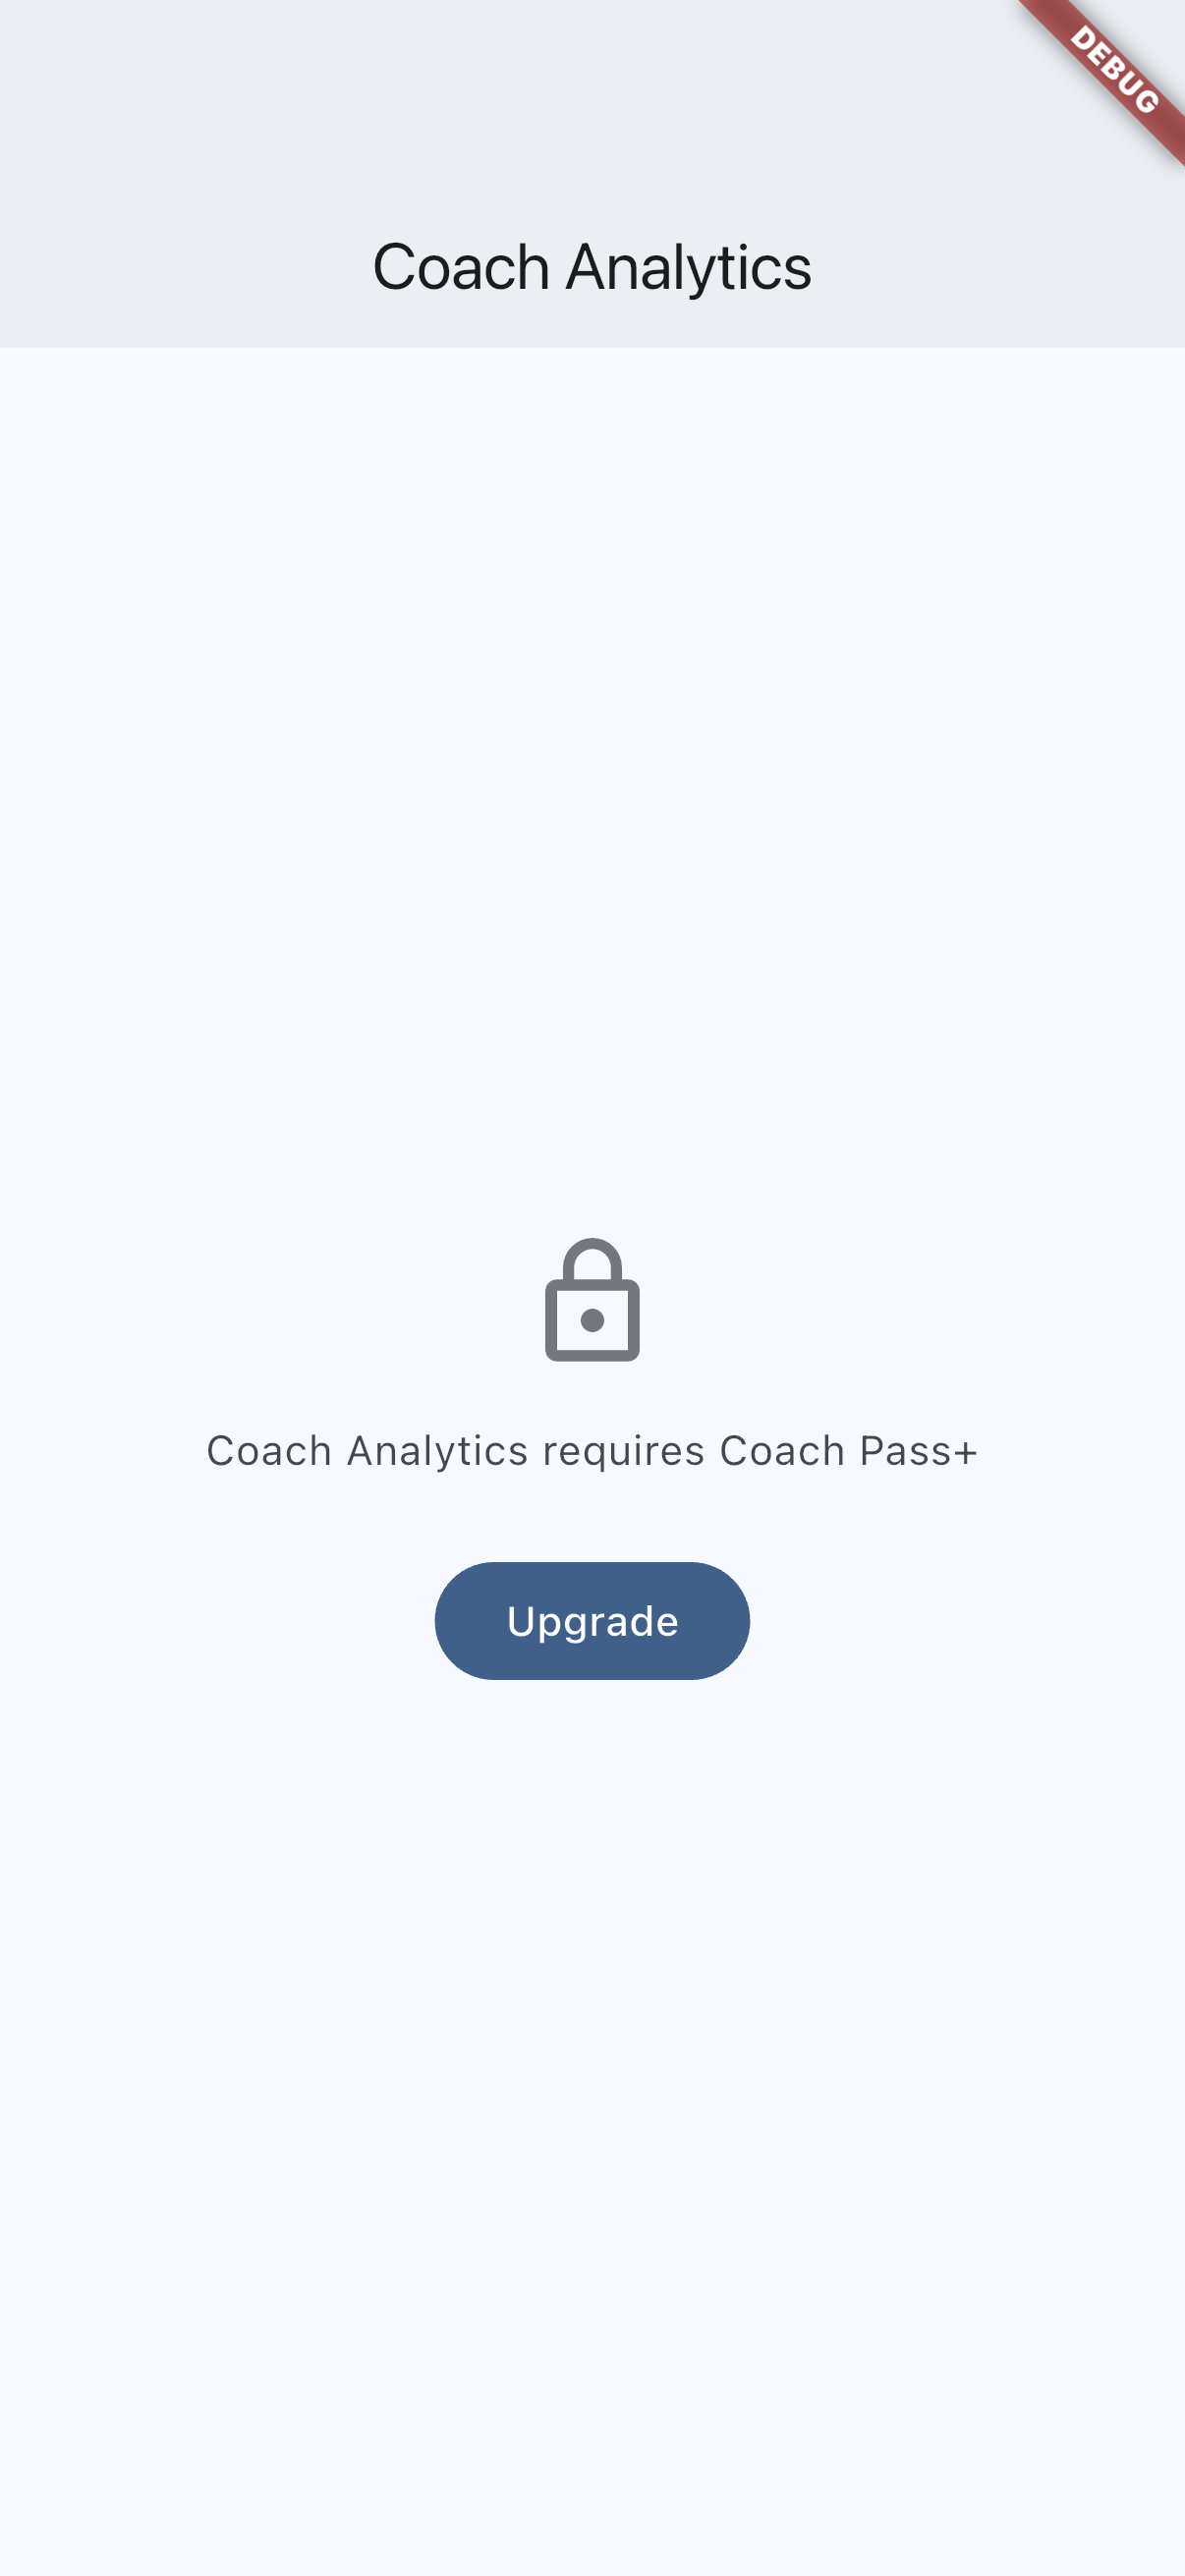
Coach Pass+Coach analytics open from the analytics shortcut on the home dashboard. If your current coach tier does not qualify, the app sends you to Coach Pass instead of the analytics dashboard.
The coach view mirrors the same two sub-tabs:
- General combines attendance, sessions, popular times, and guest trends across every group you admin.
- Activity Planning combines planning outcomes, voting engagement, and date preferences across those same groups.
The coach dashboard opens the same seven drill-downs described below, each reading across every team you admin rather than one, with a per-team breakdown so you can see which team a number came from.
What each drill-down shows
The same seven screens back both the team and the coach view. Four sit under General:
- Attendance by member — every member’s attendance rate over the last 90 days, ranked highest first, so you can see who turns up and who has quietly stopped. The rolling window means a long-standing member’s early record does not hide a recent drop-off.
- Session fill rates — participation compared across all sessions that have a maximum participant limit, which is what makes a fill rate meaningful. Use it to spot sessions that are consistently over- or under-subscribed.
- Popular times — a heatmap of average participants by day and time, plus a Top Time Slots ranking. This is the screen to open before moving a session to a new slot.
- Guest trends — total guests brought per month, so you can tell a growing group from one whose members are simply bringing more people.
Three sit under Activity Planning, and they only have data once the team has run plannings:
- Planning outcomes — a status breakdown of every planning (activated, cancelled, disabled, archived, still in progress), how each was resolved (auto-resolved or admin-selected), and an attendance comparison between planned activities and regular sessions.
- Voting engagement — per-member voting rates and compliance: plannings invited to versus plannings voted in, split by required and optional members, alongside the average IN rate.
- Date preferences — the days and times members actually vote for, plus a Selectivity Score showing how selective they are when marking a date as suitable. A low score means most dates work; a high one means the group is hard to schedule.
Exports and upgrade prompts
- Team analytics depend on the effective tier of the specific group. In the current product, the group needs Business.
- Coach analytics depend on your user-level coach tier. They require Coach Pass+.
- CSV export stays inside the analytics flow, so admins export from the same screens they are already reviewing. The General tab offers an Attendance Report, a Sessions Report, and a Members Report; the Activity Planning tab offers an Activity Planning Report and a Voting Detail Report. The coach view exports the same five across every team you admin.
- A team’s own Analytics switch under Settings → Features also decides. With it off, the team’s Analytics tab is hidden, and the team drops out of a coach’s cross-team view as well.
- If a user opens an analytics path without the required tier, the app shows upgrade messaging instead of the full dataset.
General analytics and activity-planning analytics are separate sections, and coach analytics is a separate cross-team surface again. The visible tabs and drill-down pages depend on both tier and entry point.
team-analytics-android.pngteam-analytics-ios.png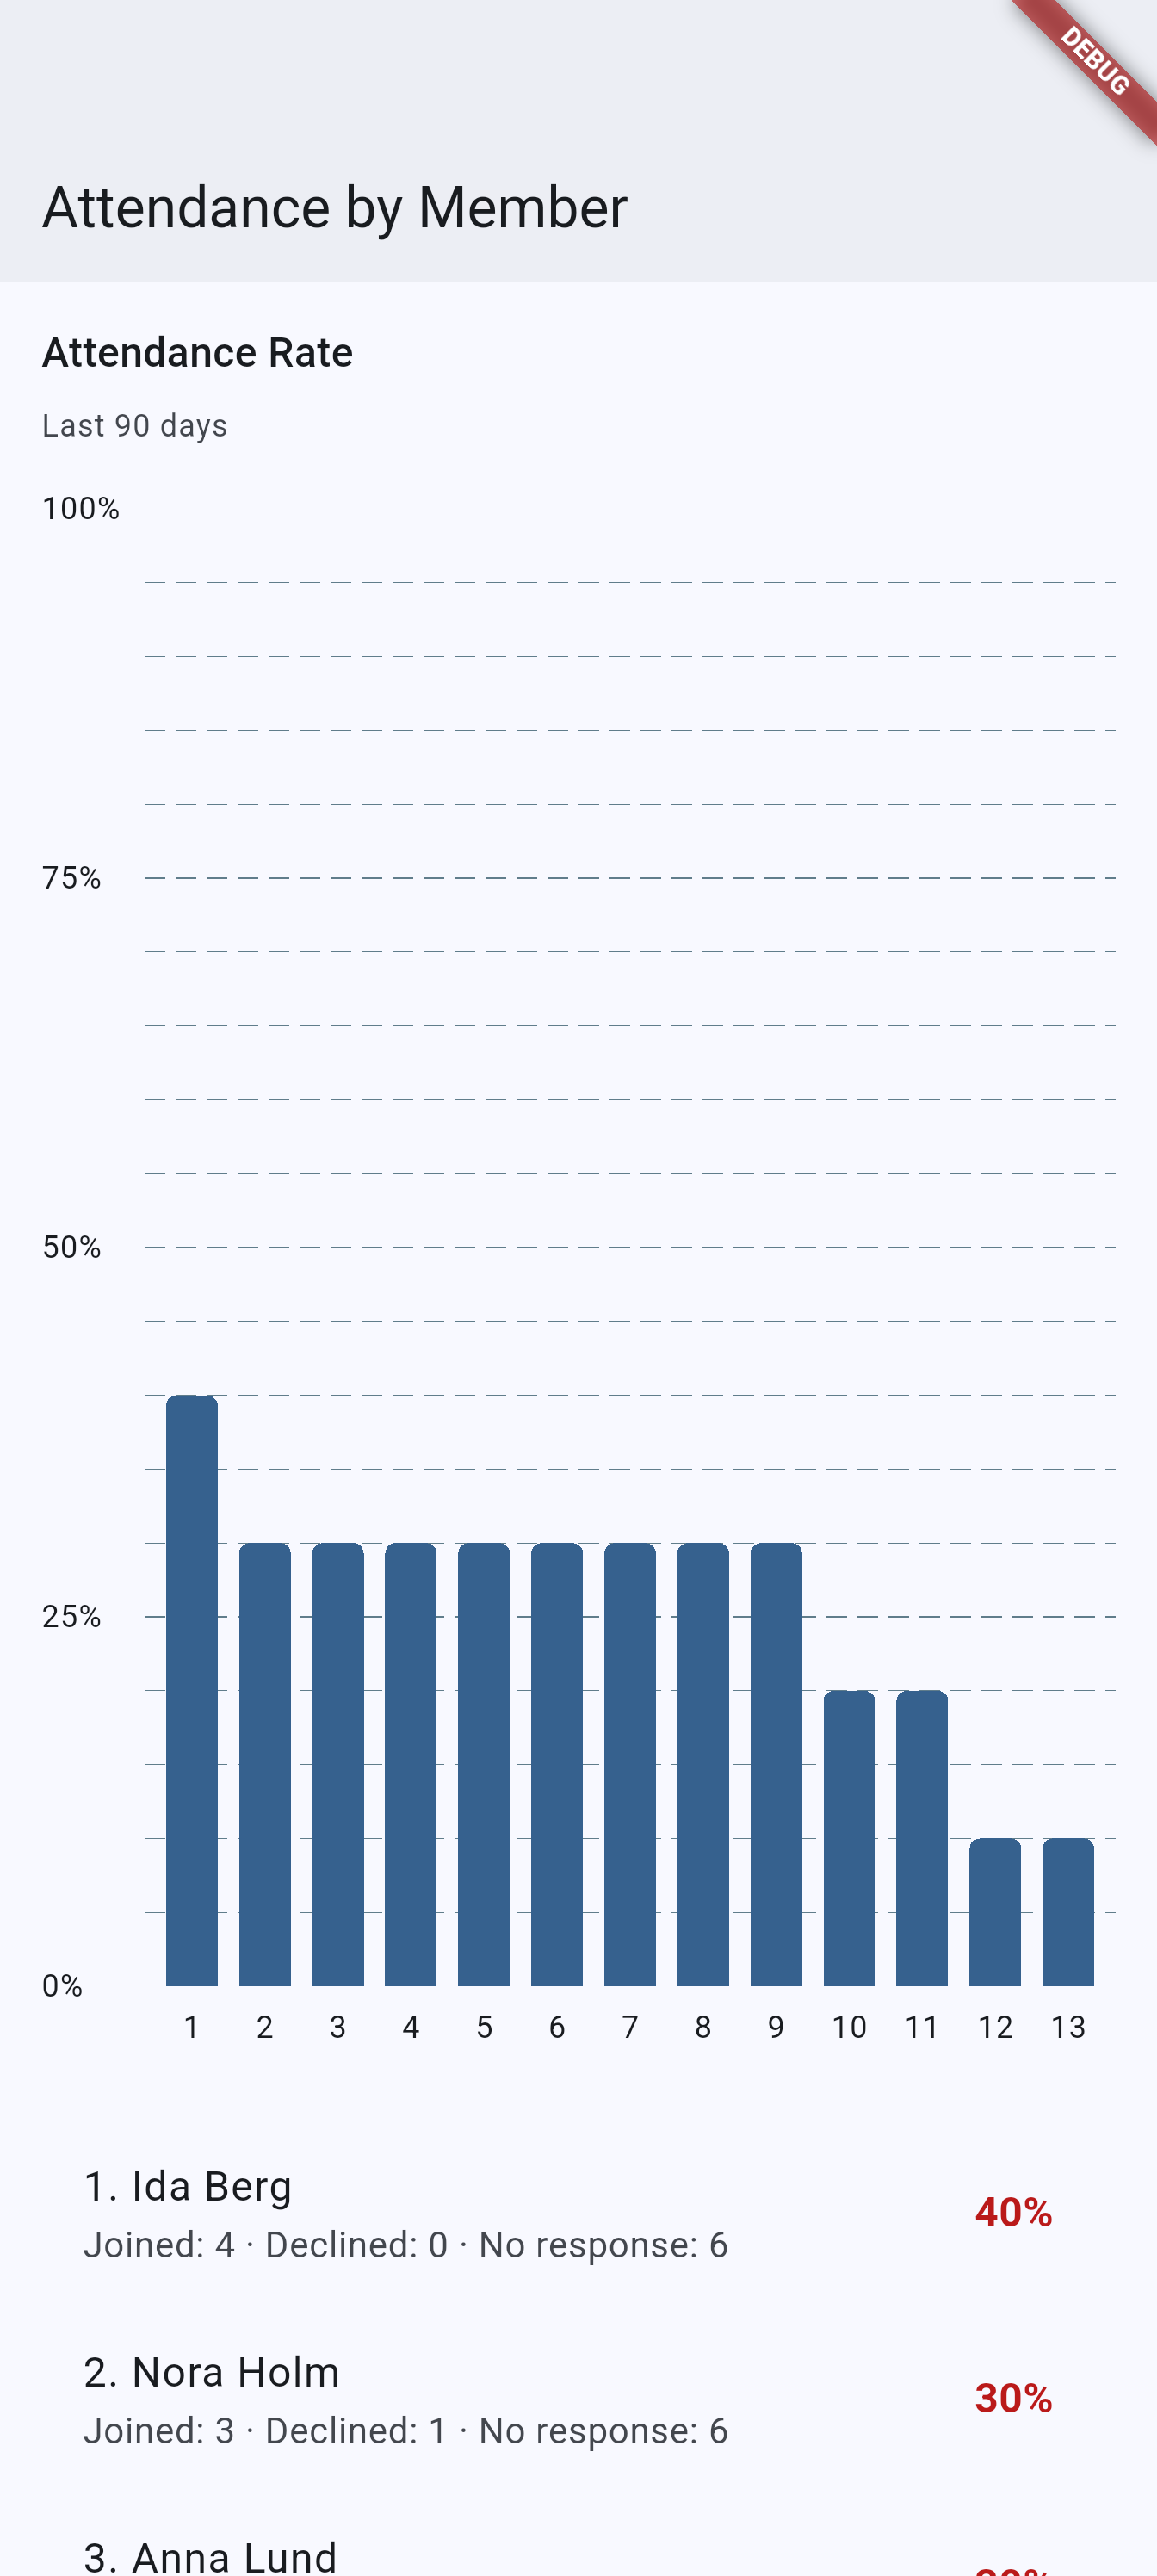
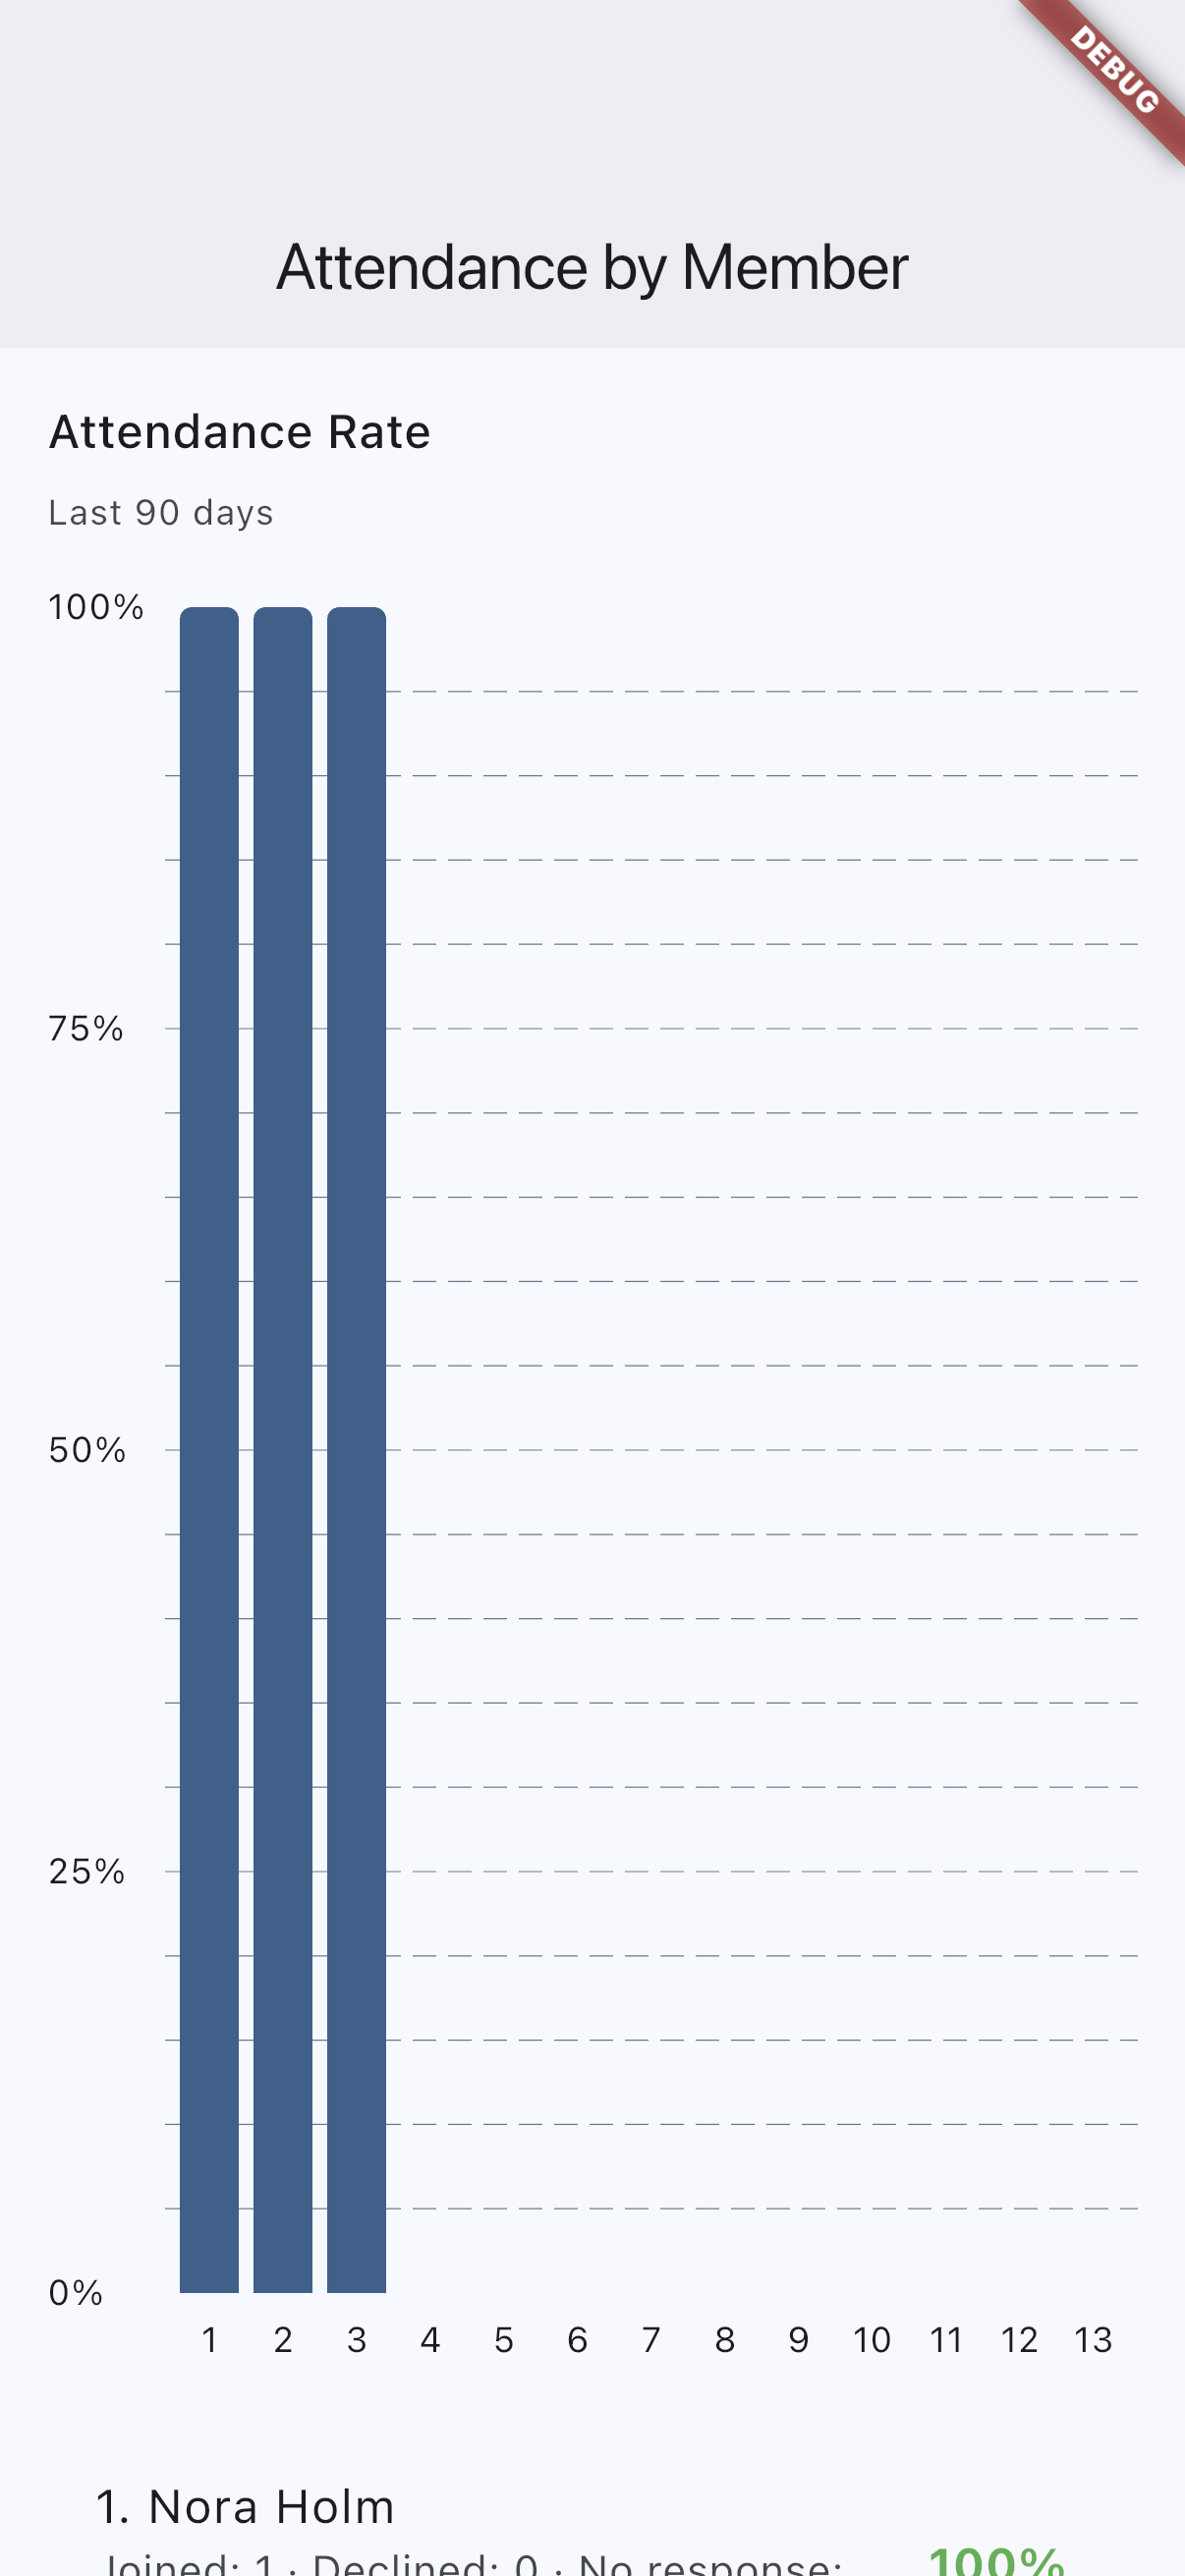
Recommended capture: one team analytics overview or chart page, preferably attendance or sessions because it is the most recognizable.
coach-analytics-android.pngcoach-analytics-ios.png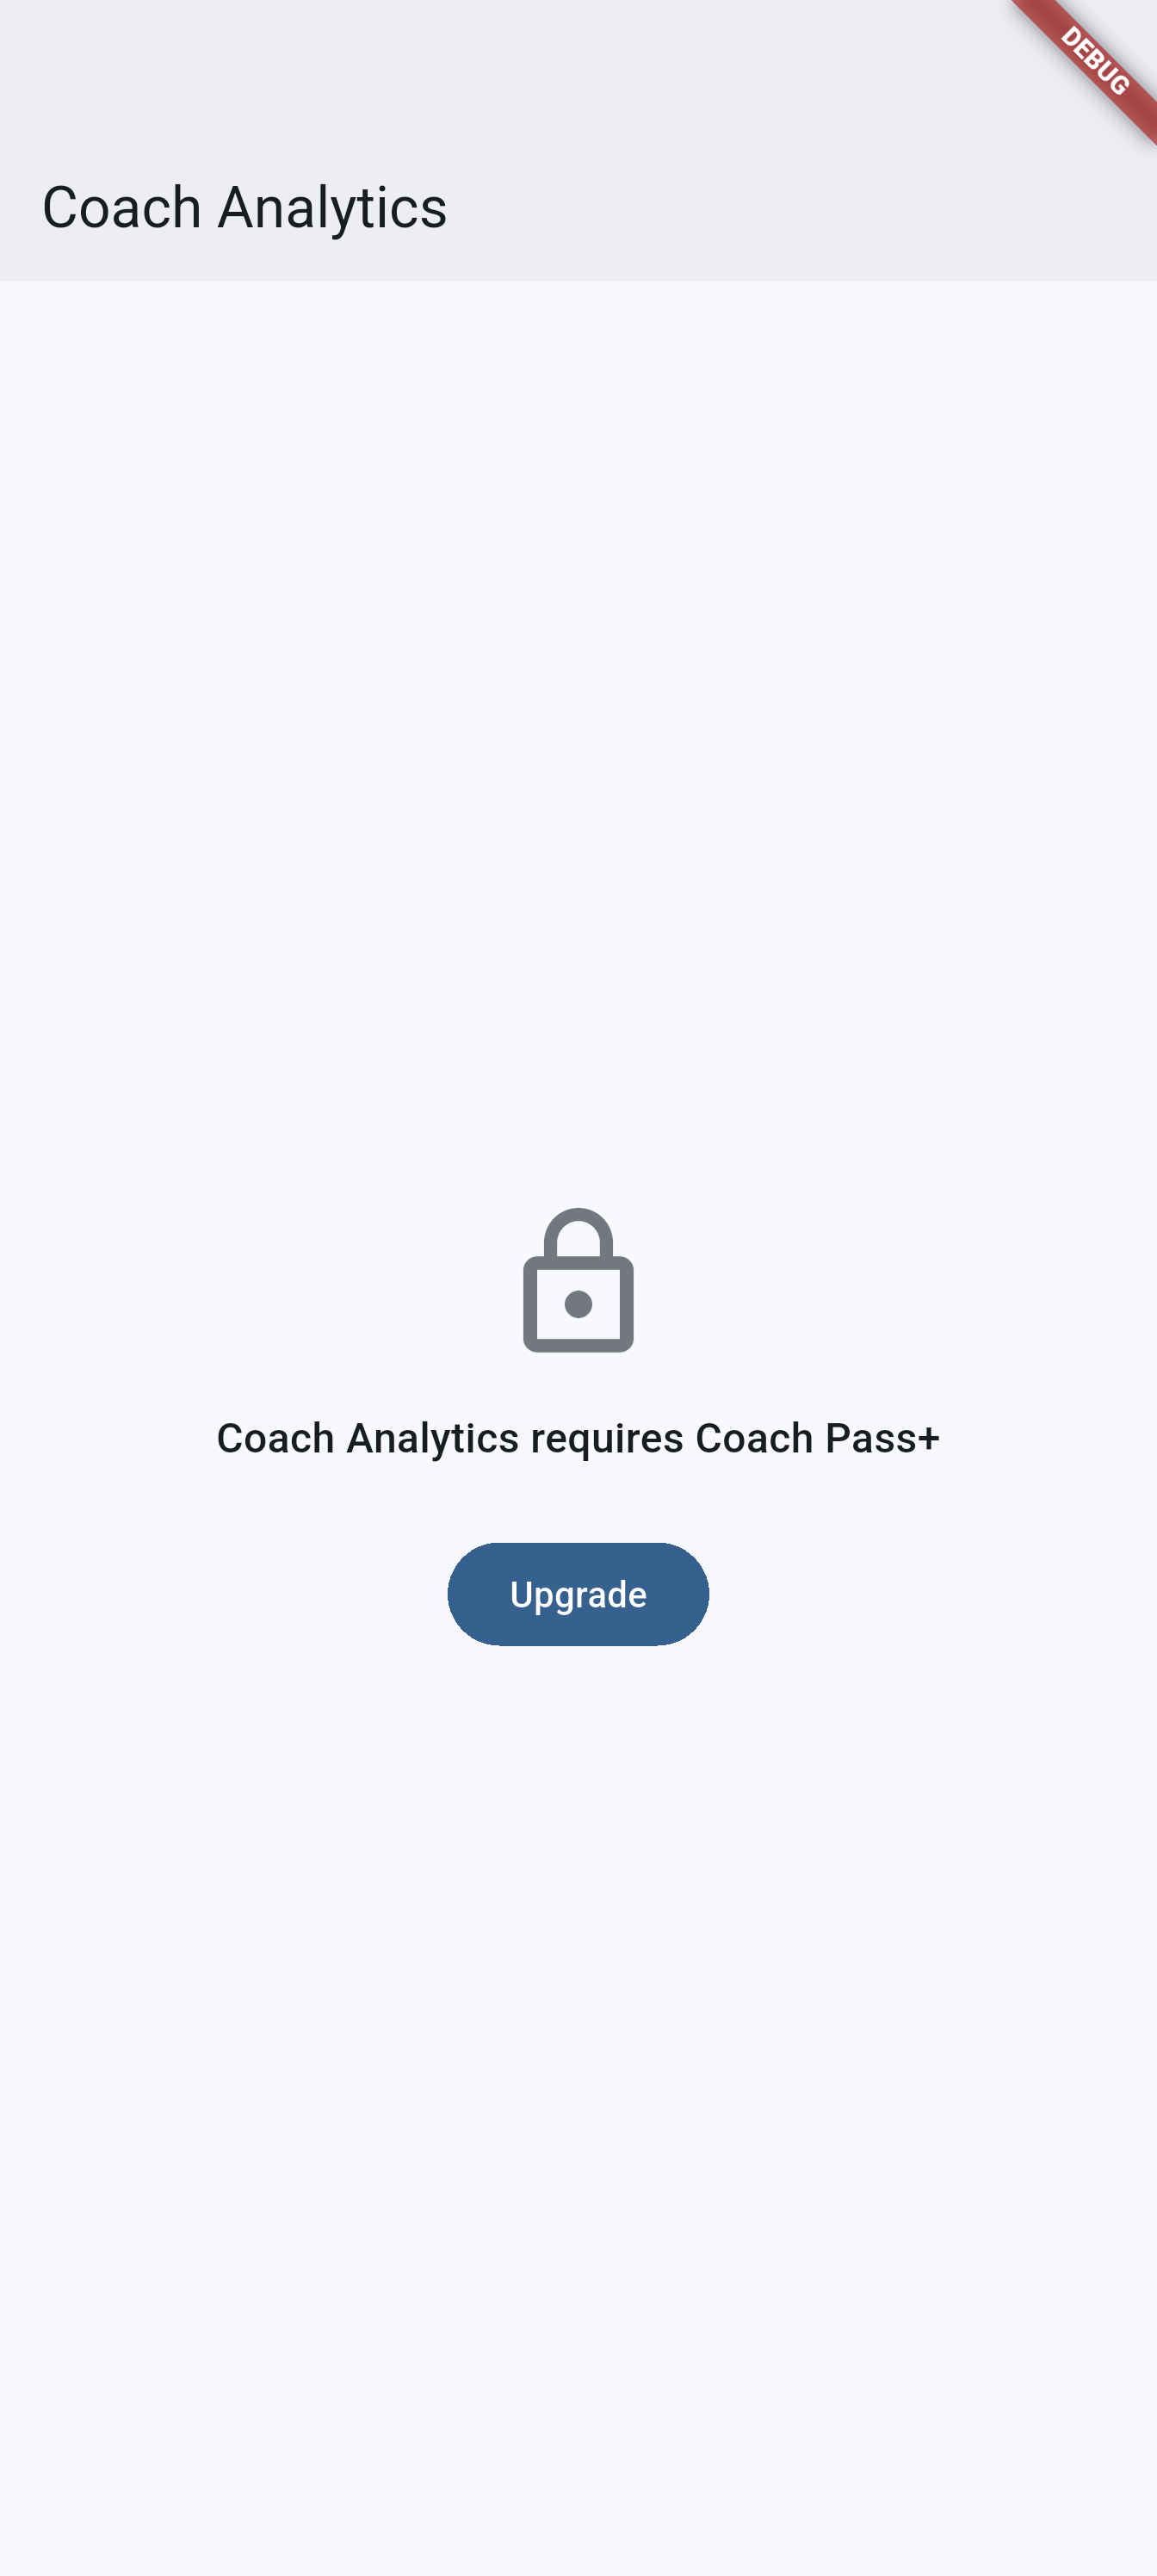
Recommended capture: the coach analytics hub with multiple teams visible in the aggregate overview.
Related pages
- Home dashboard for the analytics shortcut in the top app bar.
- Activity planning for the planning flows behind outcomes, voting engagement, and date preferences.
- Plans and billing for the tier requirements behind team and coach analytics.